Title: Understanding LongTerm Stock Declines and Reversal Patterns
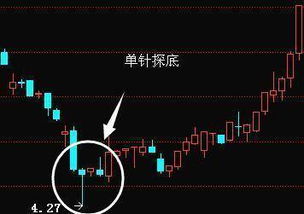
When stocks experience prolonged declines, investors often seek insights into potential reversal patterns. Understanding these patterns can provide valuable insights into market sentiment and potential shifts in trend direction. Let's delve into the dynamics of longterm stock declines and explore common reversal patterns along with guidance for navigating such scenarios.
1. Causes of LongTerm Stock Declines
Longterm stock declines can be triggered by various factors, including:

Economic Conditions:
Economic downturns or recessionary periods can dampen investor confidence, leading to extended bear markets.
CompanySpecific Issues:
Poor financial performance, management scandals, or legal troubles can erode investor trust and cause a sustained decline in a company's stock price.
Market Sentiment:
Negative market sentiment fueled by geopolitical tensions, regulatory changes, or global events can contribute to longterm downward trends.
2. Common Reversal Patterns
a. Double Bottom:
Description:
A double bottom pattern forms when a stock price reaches a low point, rallies, then declines again to a similar low before experiencing a significant upward reversal.
Interpretation:
This pattern indicates that selling pressure has exhausted twice at the same level, signaling potential accumulation by investors and a shift towards bullish sentiment.
b. Head and Shoulders:
Description:
The head and shoulders pattern consists of three peaks – a higher peak (head) between two lower peaks (shoulders) – and a neckline connecting the lows of the troughs.
Interpretation:
A head and shoulders pattern suggests a transition from bullish to bearish sentiment. A breakout below the neckline indicates a reversal, with the depth of the pattern often used to estimate the extent of the decline.
c. Falling Wedge:
Description:
A falling wedge pattern features converging trendlines sloping downward, with lower lows and lower highs.
Interpretation:
Despite the downward slope, falling wedge patterns are considered bullish reversal signals. As the price consolidates within the narrowing range, a breakout above the upper trendline suggests a reversal in trend direction.
3. Guidelines for Navigating LongTerm Declines and Reversals
a. Conduct Fundamental Analysis:
Evaluate the underlying fundamentals of the stock or company to assess its longterm viability. Look for signs of financial health, competitive advantage, and growth potential.
b. Monitor Technical Indicators:
Utilize technical analysis tools such as moving averages, relative strength index (RSI), and volume indicators to identify potential reversal signals and confirm trend changes.
c. Exercise Patience and Discipline:
Avoid impulsive reactions to shortterm price movements. Allow sufficient time for reversal patterns to develop and validate before making investment decisions.
d. Diversify Your Portfolio:
Spread your investments across different asset classes, industries, and geographic regions to mitigate the impact of individual stock declines and enhance portfolio resilience.
e. Stay Informed and Adapt:
Stay updated on market news, economic developments, and industry trends to anticipate potential shifts in market sentiment and adjust your investment strategy accordingly.
Conclusion
Longterm stock declines can be challenging for investors, but understanding reversal patterns and following strategic guidelines can help navigate these periods with greater confidence. By combining fundamental analysis, technical indicators, and disciplined decisionmaking, investors can identify opportunities amidst market uncertainties and position themselves for longterm success.
Remember, investing requires patience, diligence, and a longterm perspective. Stay informed, stay adaptable, and focus on the fundamentals to weather market fluctuations and pursue your investment goals.
